
Campus recreation departments play a crucial role in university life, fostering physical health, social engagement, and overall well-being through a variety of programs and facilities. In today’s data-driven environment, the adoption of data visualization tools and dashboard technology is revolutionizing the way these departments operate. By effectively making sense of vast amounts of collected data, campus recreation departments can demonstrate their value and effectiveness more compellingly to university leadership and stakeholders.
The Importance of Data in Campus Recreation
Facility usage, program participation, student demographics, and financial transactions generate immense amounts of data within campus recreation departments. Accurately collecting and analyzing this data is indispensable for assessing departmental performance. Comprehensive data analysis forms the backbone of strategic decision-making processes and ensures that campus recreation can effectively communicate its significance. By leveraging this data, departments can highlight not only their involvement but also the measurable impact they have on student life and university culture.
The advent of data analytics has ushered in a new era for campus recreation departments, allowing them to move beyond traditional metrics and adopt a more holistic approach. Data insights can reveal patterns in facility usage, identify popular programs, and track financial performance, which offers a clearer picture of departmental success. This systematic approach to data collection and analysis helps create compelling narratives that showcase the importance of campus recreation in promoting wellness, engagement, and community building within the student population.
The Role of Recreation Management Software
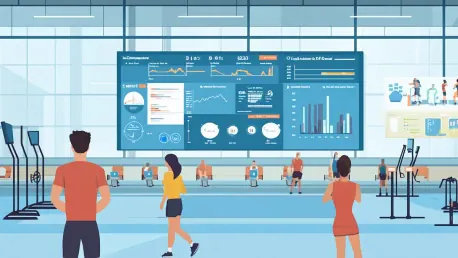
Advanced management software systems like Fusion and EZFacility have streamlined the data collection processes within campus recreation departments. However, the key challenge lies in meaningfully converting this data into actionable insights. Utilizing robust data visualization tools offers a solution to this challenge. Platforms such as Tableau and Power BI enable the creation of dynamic dashboards that transform raw data into coherent narratives. These platforms facilitate the identification of key performance indicators, allowing for real-time adjustments and strategic improvements.
Data visualization tools turn complex datasets into visually appealing summaries that are easy to understand. For instance, dashboards created on platforms like Tableau can display trends in facility usage, highlight periods of peak activity, and showcase the financial contributions of various programs all in one screen. By integrating these tools, campus recreation departments can bridge the gap between data collection and practical application, ensuring that the data is continuously updated and useful for decision-making and advocacy efforts.
Practical Applications and Success Stories
The practical application of data visualization and dashboards can be exemplified through the experiences of the University of Connecticut (UConn) and Montclair State University. At UConn, D.J. Quinn has successfully aligned dashboard development with available time and resources, advocating for a gradual yet deliberate approach. By focusing on key metrics and ensuring the continual refinement of their dashboards, UConn has enhanced its strategic capabilities and data interpretation processes.
Montclair State University, under the guidance of Tzu-Lin Toner, has also leveraged dashboards to elevate its decision-making processes. Toner emphasizes the importance of identifying key performance indicators that align with departmental goals and securing buy-in from colleagues across the university. The use of dashboards at Montclair has not only streamlined their data collection but also facilitated the transparent and effective communication of departmental successes, driving home the importance of campus recreation services.
Both universities’ experiences underscore the pivotal role of dashboards in aligning operational goals with measurable metrics and facilitating informed, transparent decision-making. The use of comprehensive data visualization has allowed these departments to tell their stories more effectively, demonstrating their impact and fostering support from university leadership.
Challenges in Dashboard Development
The path from data gathering to deploying dashboards is fraught with challenges that departments must navigate. One significant hurdle is gaining access to the required data, which often entails dealing with institutional bureaucracies and navigating through a maze of permissions and protocols. Additionally, determining which datasets are most pertinent for effective storytelling demands careful consideration and an understanding of the department’s strategic goals.
Collaboration with IT professionals is another critical component of successful dashboard implementation. IT colleagues play an essential role in managing data integration, ensuring the technical soundness of the dashboards, and troubleshooting any issues that arise. Finally, developing a robust and user-friendly dashboard is inherently a time-consuming endeavor, requiring significant patience and persistence, especially during the initial stages.
Despite these challenges, the commitment to developing well-designed dashboards is worthwhile. The end result is a powerful tool that distills complex data into straightforward, actionable insights that can be leveraged across the department’s operations. Overcoming the initial obstacles paves the way for a more data-driven approach to campus recreation management.
Strategic Benefits of Data Dashboards
The strategic benefits of utilizing data dashboards in campus recreation departments are substantial, outweighing the challenges involved. Dashboards provide hard evidence to support strategic decisions and offer deeper insights into patron and student employee demographics. This data-driven approach ensures that departments can make informed decisions that are backed by solid evidence, ultimately improving the quality and effectiveness of their services.
Accessible dashboards also become powerful storytelling tools, resonating with diverse audiences from prospective students to university administrators. These visualizations offer a clear and compelling narrative that highlights the value of campus recreation programs and facilities. Moreover, dashboards facilitate compliance with institutional reporting requirements, providing updated and organized data that justifies departmental expenditures and initiatives.
By regularly updating and refining data visualizations, departments can ensure that they maintain an accurate and up-to-date record of their operations. This, in turn, allows for continuous improvement and adaptation, ensuring that campus recreation remains responsive to the needs and preferences of the university community.
Best Practices and Recommendations
Leveraging all available data sources can maximize the insights gained from dashboards. Comprehensive data utilization, as emphasized by D.J. Quinn, leads to better operational visibility and more informed decision-making. Additionally, sharing best practices and collaborating with other campus recreation departments can significantly enhance the effectiveness of dashboard visualizations. Tzu-Lin Toner’s advice against reinventing the wheel highlights the importance of learning from others’ experiences, adopting proven strategies, and avoiding redundant efforts in dashboard development.
This collaborative approach fosters an environment of shared knowledge and continuous improvement. By working together and learning from each other’s successes, campus recreation departments can optimize their data visualization practices, ensuring that they remain at the cutting edge of data-driven decision-making and storytelling.
Transformative Impact of Data Visualization
Campus recreation departments play a pivotal role in university life by promoting physical health, social interaction, and overall wellness through diverse programs and facilities. In a world increasingly driven by data, the incorporation of data visualization tools and dashboard technology is transforming how these departments function. These advanced tools enable campus recreation departments to analyze and interpret vast amounts of data efficiently. By doing so, they can present their value and effectiveness more convincingly to university leadership and stakeholders. The use of these technologies not only helps in optimizing operations but also in illustrating the impact and importance of campus recreation initiatives on student life and university culture. As a result, these departments can better advocate for resources, improvements, and continued support, ensuring they remain a vital part of the university experience.